Maker of seating charts
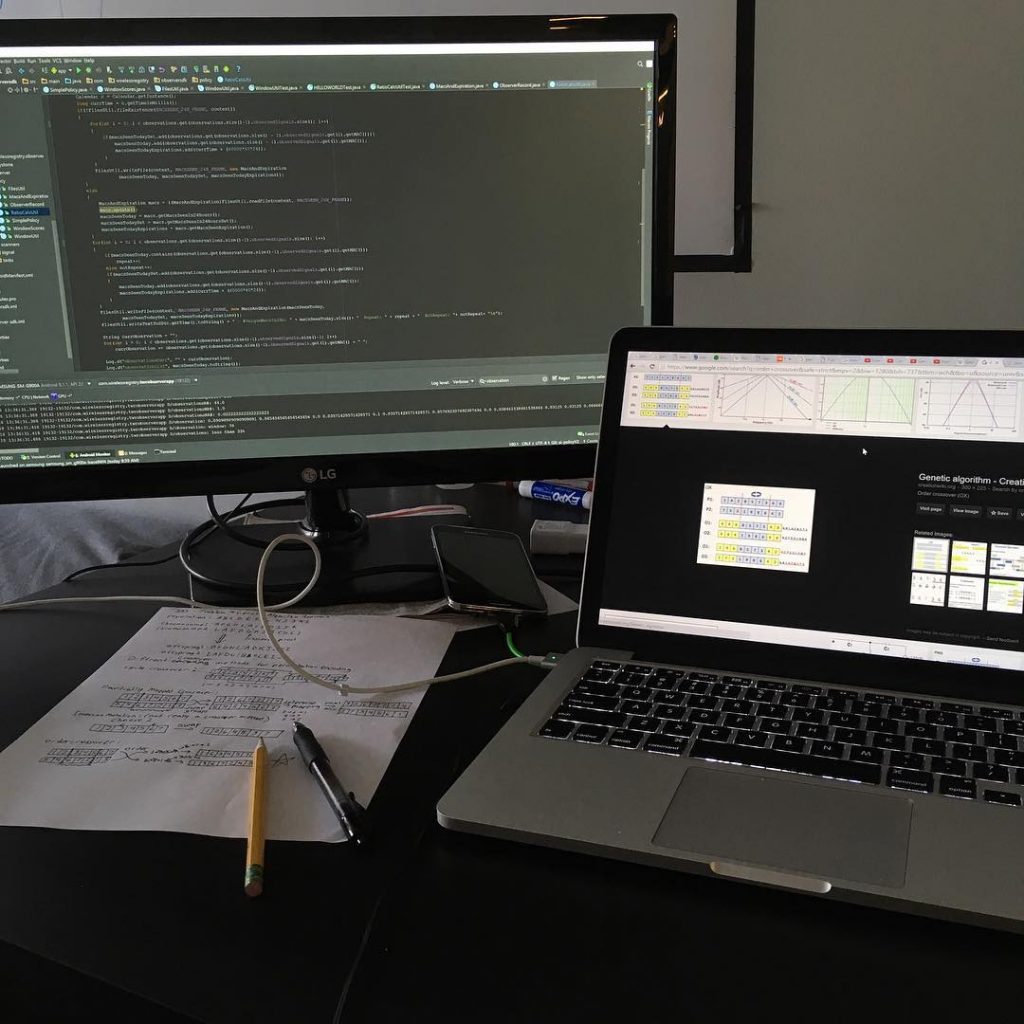
“Seat a Student”, uses student preferences and classroom layout to generate a seating chart. Data is modeled using graph data structures (implemented using adjacency lists). An evolutionary algorithm then iterates over the data to converge on an optimal seating arrangement.
| Start – Completion | Winter 2015-Summer 2016 |
| Languages & Technologies Used | Java, Machine Learning/Genetic Algorithm, Graphs (data structure) |
Inspiration
One day I watched my high school computer science teacher as she slogged through completing seating charts for each of her 5 classes. She would always pass around half sheets asking students about their seating preferences (who they did/didn’t want to sit next to, preference to sit closer to windows or front of the room, etc.). It seemed like such a repetitive and arduous task and it made me wonder if there was a way to automate it…
The idea had slipped out of my mind for a few months until I learned about a data structure called a graph. Graph’s instantly reminded me of the Seat a Student problem: each student could be a node while each listed preference for another student would be an edge connecting the two students! (I dubbed the problem “Seat a Student” to parody the intro programming class’s assignment called “Pick a Student”) I got to work coding and white boarding, and I soon realized that although I had a powerful way of modeling the problem. I had yet to find a decent way to solve it. Once again the project faded back into the depths of my mind.
That summer I participated in an internship at a startup company called “The Wireless Registry”, and they wanted me to look into methods to optimize their mobile API. One day while looking for machine learning algorithms and libraries I could implement, I came across evolutionary algorithms. I realized this was the last piece of the seat a student puzzle! I came up with a way to represent possible seating arrangements in chromosomal form and ran these in the algorithm to optimize the seating charts.
Development & Challenges
Several times during this project, I ran into roadblocks that hindered me from proceeding simply because I didn’t know enough about what I was doing to know where to even look for solutions. I overcame this just by keeping the idea/project in the back of my mind and trying to learn as much as I could. By not giving up on this project, I ended up creating a solution to a problem I had no idea how to solve when I started working on it!

Shortcomings
The UI/UX. The whole program was text-based and I never really got around to building a GUI and that made it pretty difficult to use.